Confusion matrix is a simple table used to measure how well a classification model is performing. It compares the predictions made by the model with the actual results and shows where the model was right or wrong. This helps you understand where the model is making mistakes so you can improve it. It breaks down the predictions into four categories:
- True Positive (TP): The model correctly predicted a positive outcome i.e the actual outcome was positive.
- True Negative (TN): The model correctly predicted a negative outcome i.e the actual outcome was negative.
- False Positive (FP): The model incorrectly predicted a positive outcome i.e the actual outcome was negative. It is also known as a Type I error.
- False Negative (FN): The model incorrectly predicted a negative outcome i.e the actual outcome was positive. It is also known as a Type II error.
It also helps calculate key measures like accuracy, precision and recall which give a better idea of performance especially when the data is imbalanced.
Metrics based on Confusion Matrix Data
1. Accuracy
Accuracy shows how many predictions the model got right out of all the predictions. It gives idea of overall performance but it can be misleading when one class is more dominant over the other. For example a model that predicts the majority class correctly most of the time might have high accuracy but still fail to capture important details about other classes. It can be calculated using the below formula:
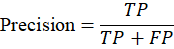
2. Precision
Precision focus on the quality of the model’s positive predictions. It tells us how many of the “positive” predictions were actually correct. It is important in situations where false positives need to be minimized such as detecting spam emails or fraud. The formula of precision is:
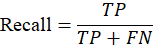
3. Recall
Recall measures how how good the model is at predicting positives. It shows the proportion of true positives detected out of all the actual positive instances. High recall is essential when missing positive cases has significant consequences like in medical tests.
4. F1-Score
F1-score combines precision and recall into a single metric to balance their trade-off. It provides a better sense of a model’s overall performance particularly for imbalanced datasets. It is helpful when both false positives and false negatives are important though it assumes precision and recall are equally important but in some situations one might matter more than the other.

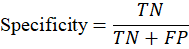
5. Specificity
Specificity is another important metric in the evaluation of classification models particularly in binary classification. It measures the ability of a model to correctly identify negative instances. Specificity is also known as the True Negative Rate Formula is given by: